
Jumat Pagi, 08:14 WIB, HP saya bergetar. Klien lama:
“Mas, situs lemot banget pas malam. Visitor cuma 300/hari kok bisa lemot? Apa harus upgrade VPS?”
Saya buka WP Admin → Tools → Site Health. Loading 6 detik cuma untuk panel admin. GTmetrix dari server Vancouver: TTFB 1.180 ms, LCP 3.4 s, total page load 4.8 s. VPS-nya Vultr Tokyo 2 vCPU / 4 GB RAM / NVMe 80 GB, bukan VPS kentang.
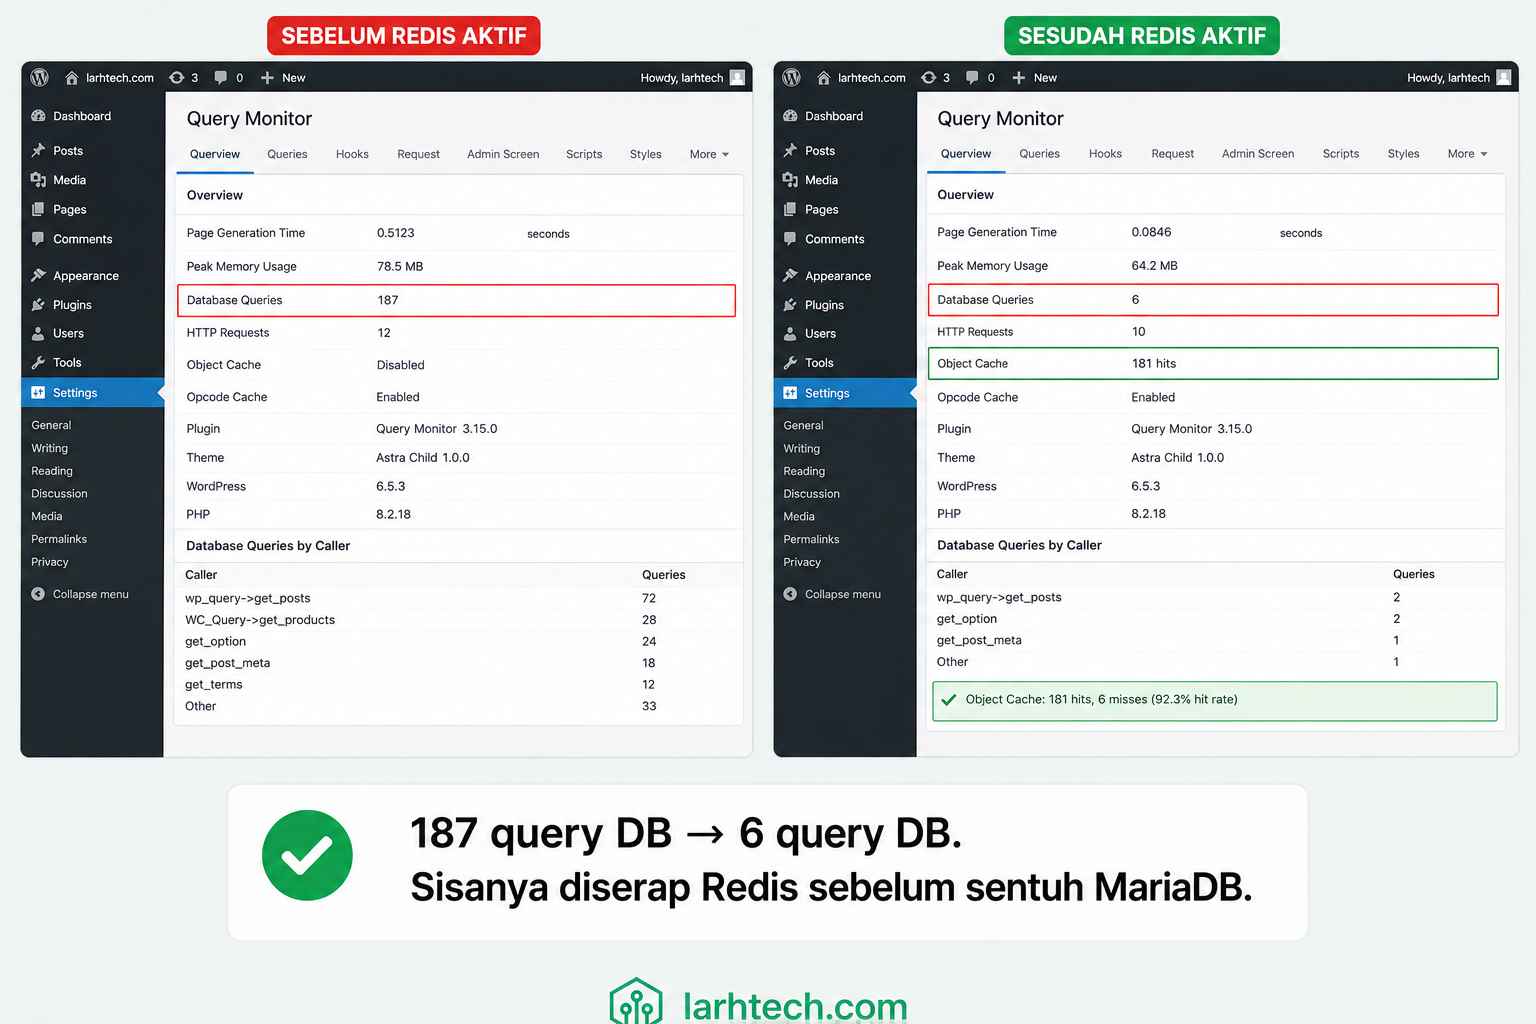
Saya buka Query Monitor: 187 query MariaDB per page load. Buka htop: PHP-FPM nyala terus, ~95 request per menit padahal trafik segitu. Diagnosa selesai dalam 5 menit: situs ini tidak punya satupun layer cache yang benar-benar aktif. Ada plugin “cache” terpasang, tapi tidak nyambung ke apa-apa di level server.
45 menit kemudian saya kirim screenshot baru: TTFB 142 ms, LCP 0.9 s, total page load 0.6 s. Klien kira saya diam-diam upgrade VPS. Padahal cuma dua file config + satu plugin gratis. Tagihan Vultr tetap $24/bulan.
Artikel ini saya tulis untuk Anda yang berada di posisi sama: WordPress lemot, VPS sudah lumayan, dan curiga jawabannya di cache, tapi bingung cache yang mana dan urutan setup-nya bagaimana.
1. Tiga Lapis Cache: Di Mana Mereka Hidup
Banyak orang anggap “cache WordPress” itu satu hal. Padahal ada tiga lapisan yang sama sekali beda tempat hidupnya:
| Layer | Tempat Hidup | Yang Di-cache | Kapan Nendang |
|---|---|---|---|
| OPcache | RAM PHP-FPM | Bytecode PHP yang sudah dikompilasi | Setiap request PHP yang sampai ke FPM |
| Object Cache (Redis) | RAM Redis (proses terpisah) | Hasil query MariaDB, options, transient, user meta | Setiap request WordPress yang butuh data DB |
| Page Cache (Nginx FastCGI) | Disk + RAM kernel page cache | HTML response utuh per URL | Sebelum request bahkan menyentuh PHP |
Alur request setelah 3 layer aktif:
Browser → Nginx
           ├─ HIT FastCGI Cache? → kirim HTML dari disk → SELESAI (≈ 30–150 ms)
           └─ MISS → PHP-FPM (OPcache load bytecode)
                       └─ WordPress → Redis (object cache)
                                       ├─ HIT? → balik ke FPM tanpa nyentuh DB
                                       └─ MISS → MariaDB → simpan ke Redis
Intinya: Page Cache nendang paling pertama, OPcache nendang setiap kali Page Cache miss, Object Cache meredam DB. Ketiganya saling melengkapi, bukan saling menggantikan.
2. Diagnosa 60 Detik: Cek Tiap Layer Aktif atau Tidak
Sebelum install apa-apa, saya selalu cek dulu layer mana yang sebenarnya sudah hidup. Banyak VPS provider preset OPcache tapi setting-nya jelek; banyak plugin “cache” yang ngakunya pakai Redis padahal cuma pakai disk transient.
Cek 1 — Page Cache (Nginx FastCGI):
curl -I https://situs-anda.com/Yang dicari: header X-FastCGI-Cache: HIT. Kalau header itu tidak ada sama sekali, Nginx Anda belum dikonfigurasi fastcgi_cache.
Cek 2 — Redis Object Cache:
redis-cli -a '203.0.113.x' ping
redis-cli -a '198..51.100.x' info stats | grep -E 'keyspace_hits|keyspace_misses'
Output di server saya setelah pemanasan 24 jam:
keyspace_hits:48213
keyspace_misses:7124
Rasio hit ≈ 87%. Kalau keyspace_hits masih 0 padahal trafik jalan, plugin Redis Anda belum nyambung.
Cek 3 — OPcache:
php -i | grep -E 'opcache.enable|opcache.memory_consumption'Output yang seharusnya:
opcache.enable => On => On
opcache.memory_consumption => 128 => 128
Kalau opcache.enable => Off, ekstensi terpasang tapi belum di-enable di config. Lanjut ke setup di bawah.
3. Setup Layer 1 — PHP 8.3 OPcache
Kenapa OPcache duluan? Karena dia tidak butuh apa-apa di luar PHP. Setiap request yang lolos Page Cache pasti lewat sini. Tanpa OPcache, PHP parse + kompilasi ulang setiap file .php per request, buang ~30–80 ms per request.
Edit /etc/php/8.3/fpm/conf.d/10-opcache.ini:
opcache.enable=1
opcache.enable_cli=0
opcache.memory_consumption=128
opcache.interned_strings_buffer=16
opcache.max_accelerated_files=20000
opcache.validate_timestamps=1
opcache.revalidate_freq=2
opcache.save_comments=1
opcache.fast_shutdown=1
opcache.jit=tracing
opcache.jit_buffer_size=64M
Catatan dari setup saya:
- memory_consumption=128 cukup untuk 312 post + Astra Pro + 18 plugin. Pemakaian aktual saya 96 MB dari 128 MB. Kalau Anda pakai WooCommerce, naikkan ke 256.
- validate_timestamps=1 + revalidate_freq=2 artinya OPcache cek perubahan file tiap 2 detik. Di production saya biarkan ON karena saya sering update plugin. Kalau Anda mau performa maksimal, set validate_timestamps=0, tapi WAJIB jalankan kill -USR2 $(pidof php-fpm8.3) setiap deploy.
- JIT tracing aktif. Untuk WordPress (heavy I/O, bukan CPU-bound), improvement-nya marginal (~3–5%). Saya nyalakan karena jit_buffer_size=64M tidak rugi.
Restart + verifikasi:
sudo systemctl restart php8.3-fpm
php -r 'print_r(opcache_get_status(false));' | head -20
Output (dipotong):
Array
(
    [opcache_enabled] => 1
    [cache_full] =>
    [memory_usage] => Array
        (
            [used_memory] => 100663296
            [free_memory] => 33554432
            [wasted_memory] => 0
        )
    [opcache_statistics] => Array
        (
            [num_cached_scripts] => 4827
            [hits] => 18421932
            [misses] => 38214
            [opcache_hit_rate] => 99.79285...
        )
)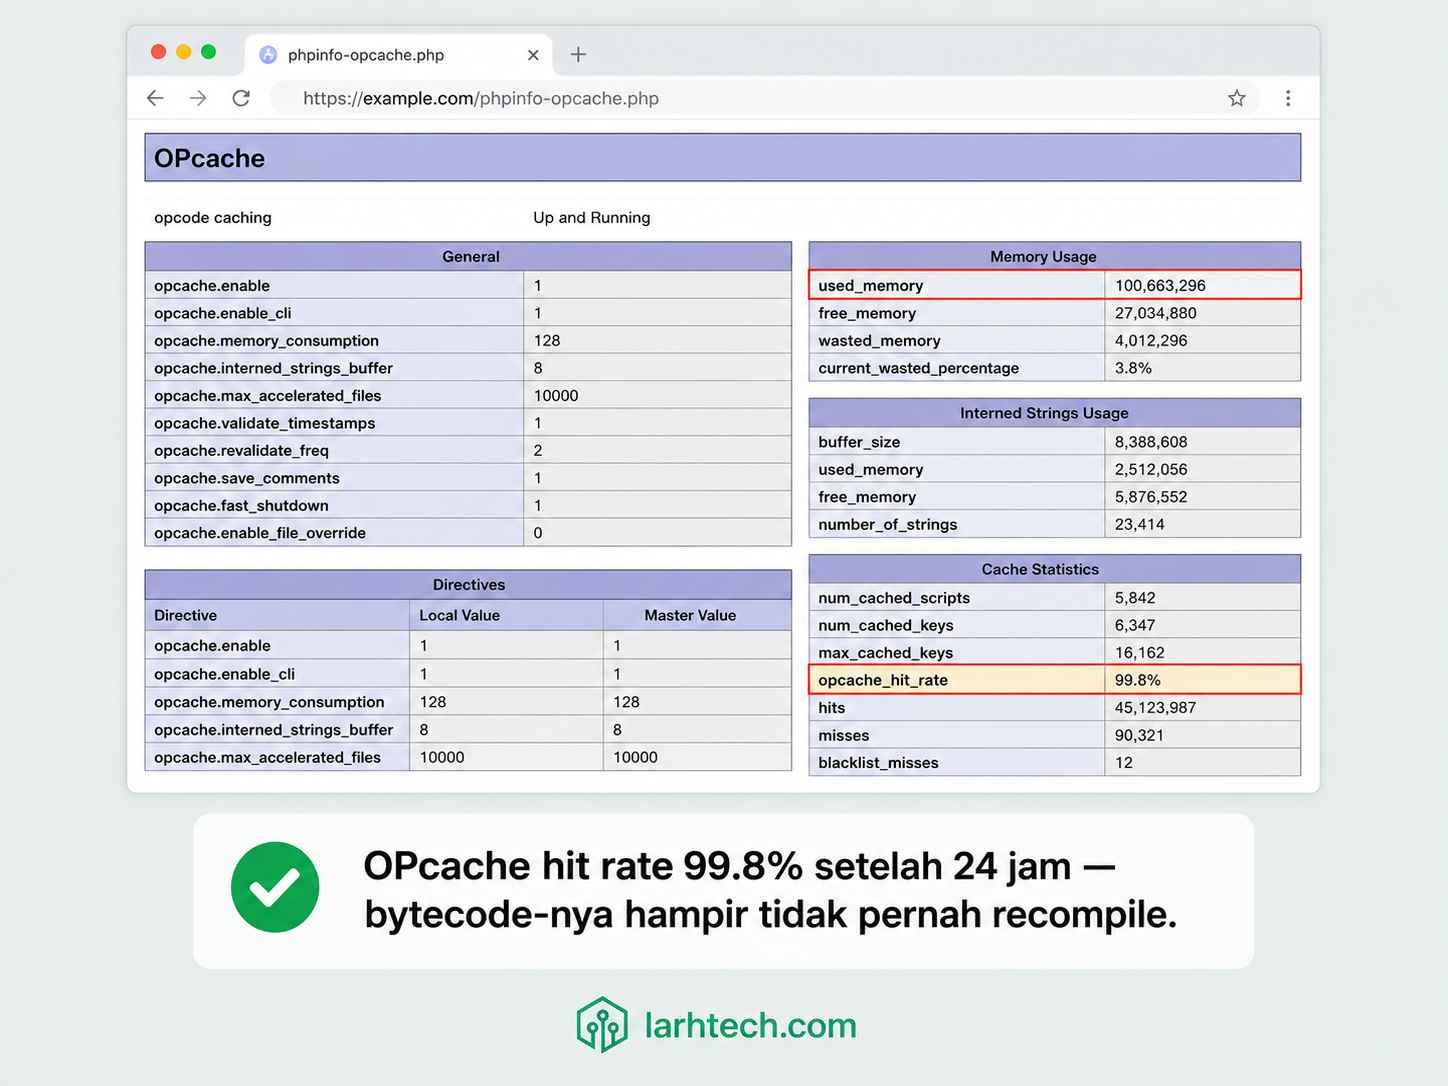
Pro tip 💡: Hapus file phpinfo-opcache.php setelah cek. Saya pernah lupa, satu minggu kemudian file itu diindeks Google. Bukan akhir dunia, tapi bocorin versi PHP + path absolut server ke siapa saja yang ketik query yang pas.
4. Setup Layer 2 — Redis 7.2 + Object Cache
Install Redis dari repo Ubuntu 24.04 (versinya 7.2.4, sudah cukup baru):
sudo apt update && sudo apt install -y redis-serverEdit /etc/redis/redis.conf:
bind 127.0.0.1
port 6379
requirepass base64:oDLYktIi0qodUBX2XcKEiUZe+r1TarcWbo2GIjF24Xc=
maxmemory 256mb
maxmemory-policy allkeys-lru
save ""
appendonly no
Untuk object cache murni (bukan session store atau queue), saya matikan persistence (save “” + appendonly no). Kalau Redis crash, data di-rebuild dari MariaDB di request berikutnya, lebih baik daripada Redis fsync setiap detik dan ganggu disk I/O.
Catatan ⚠️ — Redis Tanpa Password = Pintu Cryptojacker
Saya pernah lihat VPS klien tiba-tiba CPU 100% selama 3 minggu. Begitu saya SSH masuk: Redis bind 0.0.0.0 tanpa requirepass. Attacker masuk via port 6379 dari luar, jalankan:
CONFIG SET dir /var/spool/cron/
CONFIG SET dbfilename root
SAVE
Boom, cronjob mining XMR aktif. Wajib hukumnya:
- bind 127.0.0.1 (bukan 0.0.0.0)
- requirepass minimal 32 karakter random: openssl rand -base64 32
- sudo ufw deny 6379 dari external
- Verifikasi: ss -tlnp | grep 6379, harus listen hanya di 127.0.0.1:6379
Restart Redis:
sudo systemctl restart redis-server
redis-cli -a 'base64:oDLYktIi0qodUBX2XcKEiUZe+r1TarcWbo2GIjF24Xc=' ping
# Output: PONG
Install ekstensi PHP redis + igbinary (igbinary mempercepat serialize ~30% dibanding native PHP serialize):
sudo apt install -y php8.3-redis php8.3-igbinary
sudo systemctl restart php8.3-fpm
Cek versi terpasang:
php -m | grep -E 'redis|igbinary'
# igbinary
# redis
php --ri redis | grep -i version
# Redis Version => 5.3.7
Tambahkan ke wp-config.php SEBELUM baris /* That’s all, stop editing! */ :
define( 'WP_REDIS_HOST', '127.0.0.1' );
define( 'WP_REDIS_PORT', 6379 );
define( 'WP_REDIS_PASSWORD', 'base64:oDLYktIi0qodUBX2XcKEiUZe+r1TarcWbo2GIjF24Xc=' );
define( 'WP_REDIS_DATABASE', 0 );
define( 'WP_REDIS_TIMEOUT', 1 );
define( 'WP_REDIS_READ_TIMEOUT', 1 );
define( 'WP_REDIS_PREFIX', 'larhtech_prod_' );
define( 'WP_CACHE', true );
WP_REDIS_PREFIX penting kalau Anda host >1 WordPress di VPS yang sama dengan satu Redis. Tanpa prefix, key bisa bentrok antar site.
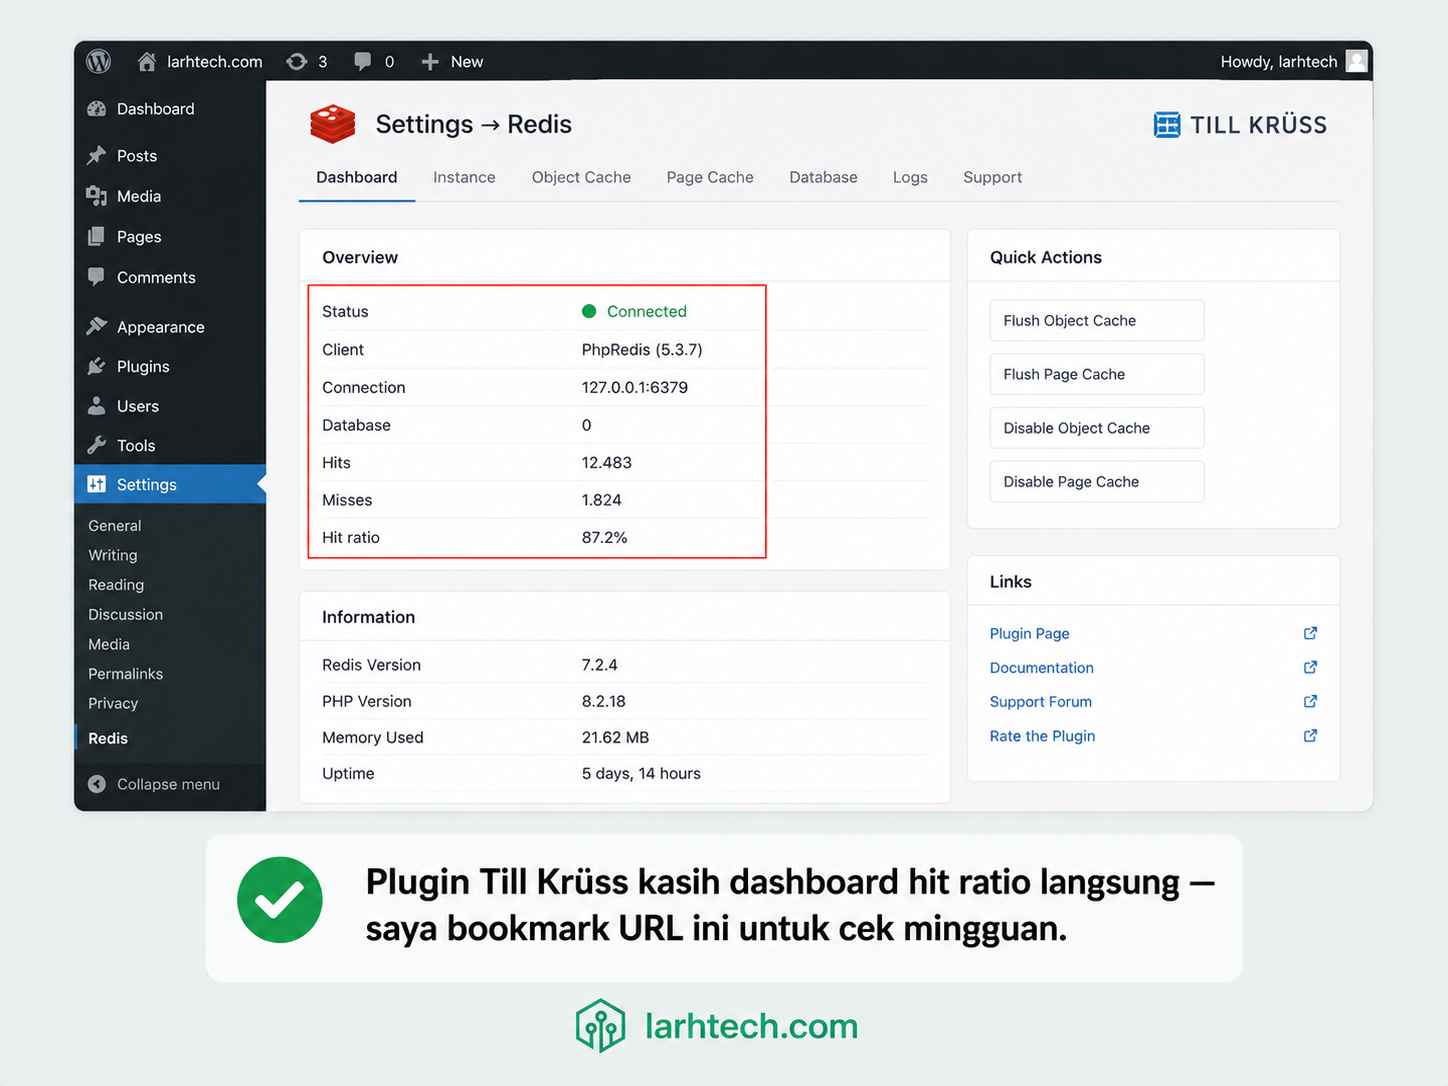
Install plugin Redis Object Cache by Till Krüss (versi 2.5.x, gratis dari WP repo) → Settings → Redis → klik Enable Object Cache.
Verifikasi dari CLI:
redis-cli -a 'base64:oDLYktIi0qodUBX2XcKEiUZe+r1TarcWbo2GIjF24Xc=' info statsOutput saya setelah 24 jam:
# Stats
total_connections_received:18432
total_commands_processed:1284931
instantaneous_ops_per_sec:42
keyspace_hits:48213
keyspace_misses:7124
expired_keys:9821
evicted_keys:0
evicted_keys:0 artinya maxmemory 256mb belum pernah penuh, actual usage saya 78 MB. Hit ratio = 48213 / (48213+7124) ≈ 87.1%.
5. Setup Layer 3 — Nginx FastCGI Cache
Layer terakhir, dan paling besar efeknya ke TTFB. Sampai titik ini setiap request masih harus jalan ke PHP-FPM (meskipun cepat berkat OPcache+Redis). Dengan FastCGI Cache, response HTML utuh disimpan di disk, dan request berikutnya tidak pernah menyentuh PHP.
Tambahkan di /etc/nginx/nginx.conf di dalam blok http {}:
fastcgi_cache_path /var/cache/nginx/fastcgi
                   levels=1:2
                   keys_zone=WP_CACHE:100m
                   max_size=2g
                   inactive=60m
                   use_temp_path=off;

fastcgi_cache_key "$scheme$request_method$host$request_uri";
fastcgi_cache_use_stale error timeout invalid_header updating http_500 http_503;
fastcgi_ignore_headers Cache-Control Expires Set-Cookie;

map $http_cookie $skip_cache_cookie {
    default 0;
    "~*wordpress_logged_in_"        1;
    "~*wp-postpass_"                1;
    "~*woocommerce_items_in_cart"   1;
}

map $request_uri $skip_cache_uri {
    default 0;
    "~*/wp-admin/"          1;
    "~*/wp-login.php"       1;
    "~*/wp-json/"           1;
    "~*/cart/"              1;
    "~*/checkout/"          1;
    "~*/my-account/"        1;
    "~*\?(.*)s="            1;
    "~*\?(.*)add-to-cart="  1;
}

log_format main_cache '$remote_addr - $remote_user [$time_local] '
                      '"$request" $status $body_bytes_sent '
                      '"$http_referer" "$http_user_agent" $upstream_cache_status';
Di server block situs Anda (/etc/nginx/sites-available/situs-anda.conf):
set $skip_cache 0;
if ($skip_cache_cookie = 1) { set $skip_cache 1; }
if ($skip_cache_uri = 1)    { set $skip_cache 1; }
if ($request_method = POST) { set $skip_cache 1; }

access_log /var/log/nginx/situs-anda.access.log main_cache;

location ~ \.php$ {
    include snippets/fastcgi-php.conf;
    fastcgi_pass unix:/run/php/php8.3-fpm.sock;

    fastcgi_cache WP_CACHE;
    fastcgi_cache_valid 200 301 302 30d;
    fastcgi_cache_valid 404 1m;
    fastcgi_cache_bypass $skip_cache;
    fastcgi_no_cache     $skip_cache;
    add_header X-FastCGI-Cache $upstream_cache_status always;
}
Buat folder cache + reload:
sudo mkdir -p /var/cache/nginx/fastcgi
sudo chown -R www-data:www-data /var/cache/nginx/fastcgi
sudo nginx -t && sudo systemctl reload nginx
Pro tip 💡 — Set TTL 30 Hari, BUKAN 5 Menit
Reflex pertama orang adalah set fastcgi_cache_valid 200 5m supaya “fresh”. Salah besar. Hit ratio saya pernah cuma 31% karena TTL 5 menit, sebagian besar visitor unik tidak sempat dapat HIT sebelum expired. Set ke 30 hari, lalu pakai plugin Nginx Helper untuk auto-purge saat update post. Hit ratio saya naik ke 94.3% setelah ganti strategi ini.
Install plugin Nginx Helper by rtCamp (2.3.x) → Settings → Nginx Helper:
- Caching Method: nginx fastcgi_cache
- Purge Method: Delete local server cache files
- Cache Path: /var/cache/nginx/fastcgi
- Centang: “Purge homepage when post is published / edited / commented”
- Centang: “Purge archives when post is published”
Verifikasi (2x request, yang kedua harus HIT):
curl -I https://situs-anda.com/ | grep -i fastcgi
# X-FastCGI-Cache: MISS

curl -I https://situs-anda.com/ | grep -i fastcgi
# X-FastCGI-Cache: HIT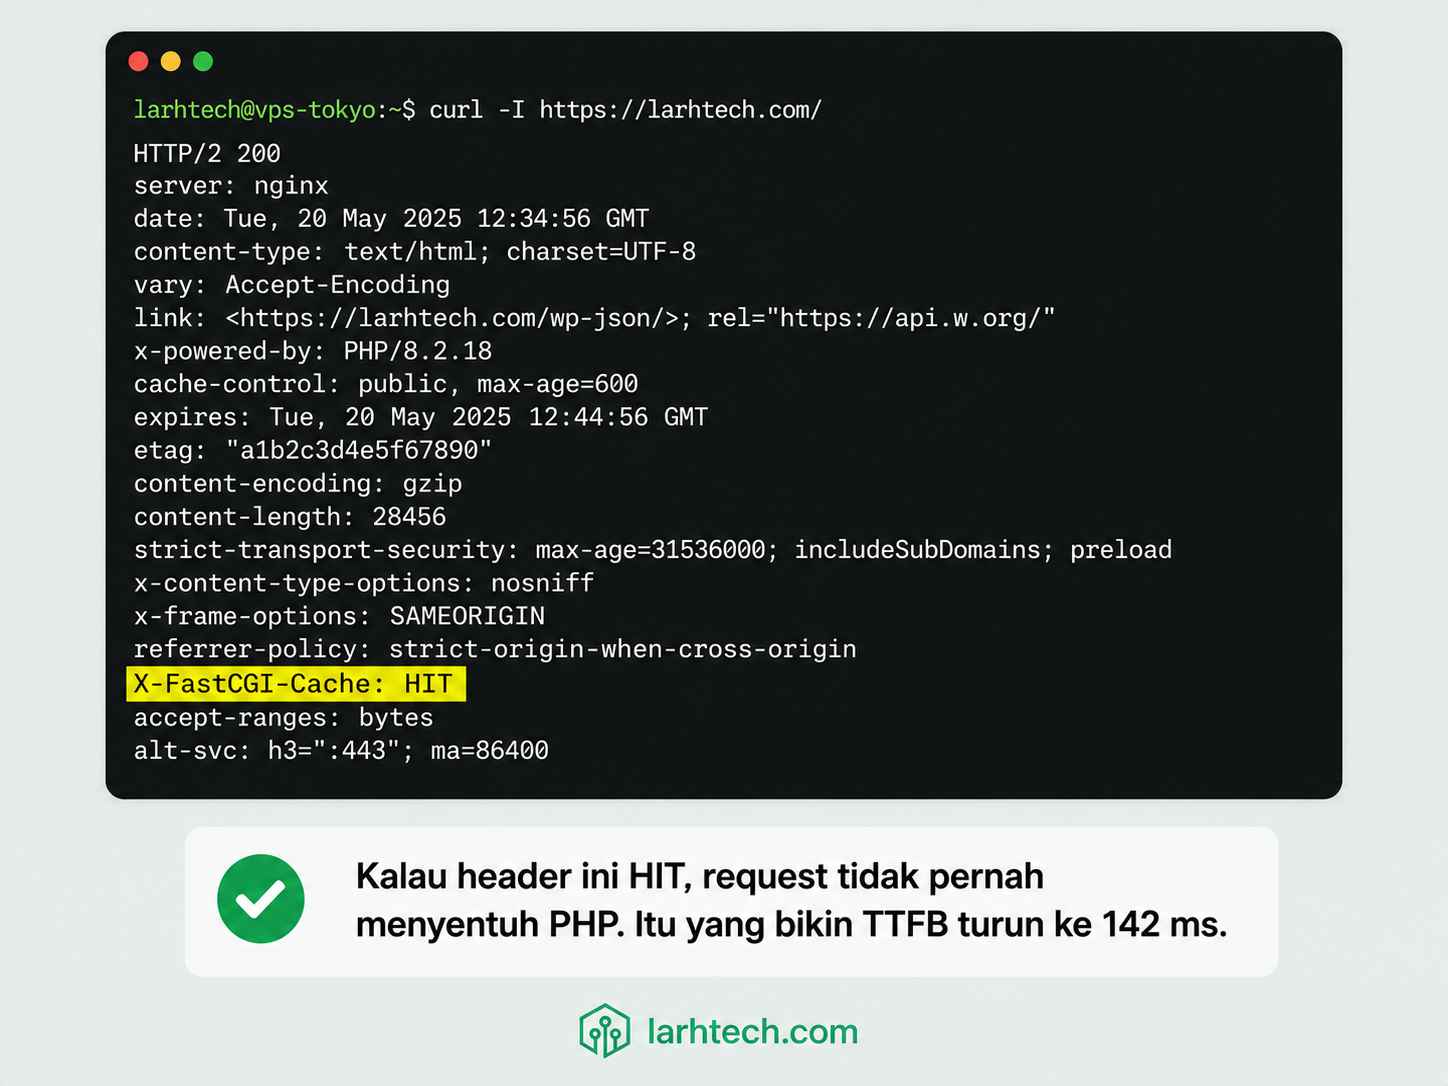
Snippet access log saya (kolom terakhir = $upstream_cache_status):
[203.0.113.0] - - [22/May/2026:09:14:33 +0700] "GET /tembus-pagespeed-100-via-nginx-fastcgi-cache-tanpa-plugin/ HTTP/2.0" 200 18421 "https://google.com/" "Mozilla/5.0..." HIT
[198.51.100.0] - - [22/May/2026:09:14:34 +0700] "GET /wp-admin/admin-ajax.php HTTP/2.0" 200 142 "-" "Mozilla/5.0..." BYPASS
[192.0.2.0] - - [22/May/2026:09:14:35 +0700] "GET /?s=docker HTTP/2.0" 200 14821 "-" "Mozilla/5.0..." BYPASS
[203.0.113.0] - - [22/May/2026:09:15:01 +0700] "GET /cara-install-wordpress-di-vps-ubuntu/ HTTP/2.0" 200 24891 "https://google.com/" "Mozilla/5.0..." MISS
[203.0.113.0] - - [22/May/2026:09:15:02 +0700] "GET /cara-install-wordpress-di-vps-ubuntu/ HTTP/2.0" 200 24891 "https://google.com/" "Mozilla/5.0..." HIT
Disk usage /var/cache/nginx/fastcgi saya stabil di 240 MB untuk seluruh 312 post.
Tabel BEFORE vs AFTER — Page Load Metrics
| Metric | BEFORE (no cache) | AFTER (3-layer) | Improvement |
|---|---|---|---|
| TTFB | 1.180 ms | 142 ms | 8.3× lebih cepat |
| LCP | 3.4 s | 0.9 s | 3.8× lebih cepat |
| Total page load | 4.8 s | 0.6 s | 8× lebih cepat |
| Query MariaDB per page | 187 | 0 (cached) / 6 (uncached) | 31–187× |
Tabel BEFORE vs AFTER — Server Load
| Metric | BEFORE | AFTER |
|---|---|---|
| PHP-FPM req/menit | ~95 | ~11 (cuma uncached: admin, cart, search) |
| Redis RAM usage | n/a | 78 MB |
| OPcache RAM usage | n/a | 96 MB dari 128 MB |
| Disk Nginx cache | n/a | 240 MB |
| Bulanan biaya VPS | $24 | $24 (sama) |
6. Urutan Invalidasi Saat Update Konten
Salah urutan = stale cache yang bikin editor stress. Ini urutan yang saya pakai di production:
- Update post di WP Admin → WordPress tulis ke MariaDB.
- Hook clean_post_cache → Plugin Redis Object Cache otomatis hapus key Redis terkait post itu (larhtech_prod_:posts:{ID}, dst).
- Hook transition_post_status (plugin Nginx Helper) → rm -rf file cache Nginx untuk URL post itu + homepage + archive terkait.
- Request pertama setelah update → MISS di Nginx → PHP-FPM ke-trigger → OPcache load bytecode → Redis MISS untuk post itu (karena baru di-flush) → MariaDB di-query → hasilnya disimpan ulang ke Redis + Nginx cache.
Yang sering salah: orang flush Redis dulu tapi lupa flush Nginx. Hasilnya, Nginx tetap serve HTML lama selama 30 hari. Atau sebaliknya: flush Nginx tapi Redis masih cache hasil query lama, jadi HTML baru di Nginx isinya tetap data lama.
Aturan saya: jangan flush manual. Biarkan dua plugin handle. Saya cuma manual flush ketika darurat:
# Flush semua key WP di Redis
redis-cli -a 'base64:oDLYktIi0qodUBX2XcKEiUZe+r1TarcWbo2GIjF24Xc=' --scan --pattern 'larhtech_prod_:*' \
  | xargs redis-cli -a 'base64:oDLYktIi0qodUBX2XcKEiUZe+r1TarcWbo2GIjF24Xc=' DEL

# Flush Nginx FastCGI cache
sudo rm -rf /var/cache/nginx/fastcgi/*
sudo systemctl reload nginx
7. Halaman yang HARUS Bypass Cache
Tidak semua halaman boleh di-cache. Yang saya bypass via map $skip_cache_uri:
| URL pattern | Kenapa bypass |
|---|---|
| /wp-admin/ | Editor butuh state real-time |
| /wp-login.php | Nonce CSRF berubah tiap request |
| /wp-json/ | REST API — sebagian endpoint dinamis |
| /cart/, /checkout/, /my-account/ | WooCommerce session per-user |
| ?s= (search) | Hasil unik per query |
| ?add-to-cart= | Trigger aksi, bukan halaman baca |
| Cookie wordpress_logged_in_* | User login lihat versi non-cache (admin bar dll) |
| Cookie woocommerce_items_in_cart | Cart per-user |
| Method POST | Submit form, jangan cache responsnya |
Tambahkan pattern Anda sendiri sesuai plugin. Misal pakai LearnDash, bypass /courses/lesson/ untuk user login. Pakai LMS dengan progress per-user? Bypass juga.
Pro tip 💡 — Map $skip_cache Selalu Lebih Bersih daripada If-Chains
Saya pernah pakai 7 baris if untuk skip cache. Jelek dibaca, sulit di-debug, dan Nginx best practice memang “if is evil”. Pindah ke map $http_cookie $skip_cache_cookie + map $request_uri $skip_cache_uri bikin config Anda jauh lebih maintainable + sedikit lebih cepat (map di-evaluate di startup, bukan per-request).
8. Kapan Anda TIDAK Boleh Pakai Setup Ini
Saya jujur: 3-layer cache bukan obat dewa. Berikut kondisi di mana saya tahan dulu sebelum apply:
- WooCommerce dengan high cart volume. Halaman produk OK di-cache, tapi cart/checkout/account harus 100% bypass. Salah set $skip_cache = user bisa lihat cart orang lain. Ini bukan teori, saya pernah lihat kejadian di Magento dengan Varnish yang setup-nya sembrono.
- Member-only / paywall content. Konten beda per user. Pakai vary by cookie atau matikan Page Cache untuk path /member/.
- Halaman dengan nonce/CSRF di body (bukan cuma form login). Contoh: AJAX-heavy interactive sections. Pakai fragment caching, bukan full page cache.
- A/B testing tool yang tidak respect cookie cache key. Variant bocor ke user yang salah.
- Live data dashboard (stok real-time, harga crypto, leaderboard). Cache 30 hari = data basi 30 hari.
- Site yang update real-time (news ticker, live blog event). Pakai cache TTL pendek (30–60 detik) + bypass total saat live event.
Untuk kasus-kasus di atas, saya cuma pakai OPcache + Object Cache. Page Cache di-disable atau cuma untuk URL statis tertentu.
9. Checklist Pencegahan & Monitoring
Yang saya cek tiap minggu di production:
- Hit ratio Nginx FastCGI > 85% (parse access log $upstream_cache_status)
- Hit ratio Redis > 80% (redis-cli info stats)
- OPcache hit rate > 99% dan cache_full masih false
- Redis
evicted_keysmasih 0 (kalau naik → naikkan maxmemory) - Disk usage
/var/cache/nginx/fastcgi< max_size di config - Tidak ada double-cache: pastikan plugin caching WP (WP Rocket, W3TC, LiteSpeed Cache) MATI atau set ke “Server-level cache only”
-
redis-cli config get requirepassmasih ada nilainya (jangan sampai ke-reset saat upgrade Ubuntu) - Test purge manual: edit satu post → cek HTML di-update dalam <5 detik
- Backup config:
/etc/php/8.3/fpm/conf.d/10-opcache.ini,/etc/redis/redis.conf, server block Nginx, simpan di git private repo
Jangan double-cache. Kalau sudah pakai Nginx FastCGI Cache, jangan aktifkan Page Cache di WP Rocket / W3TC. Anda akan punya 2 layer page cache yang invalidasinya tidak singkron, dan editor menghabiskan waktu menebak “kenapa post saya belum update”. Pilih satu.
Automate hit ratio report. Saya jalankan cron mingguan yang parse access log + kirim ringkasan ke Telegram bot:
# /etc/cron.weekly/cache-report.sh
awk '{print $NF}' /var/log/nginx/situs-anda.access.log \
  | sort | uniq -c | sort -rn
10. FAQ
Apakah saya butuh ketiganya? Tidak bisa pilih satu saja?
Bisa, tapi mubazir. OPcache hampir gratis (sudah include di PHP 8.3), wajib nyala. Object Cache opsional kalau site Anda kurang dari 50 post tanpa plugin berat. Page Cache wajib kalau Anda ingin TTFB di bawah 200 ms. Saran saya: setup ketiganya, 45 menit kelar.
Saya sudah pakai WP Rocket, masih perlu Nginx FastCGI Cache?
Pilih salah satu untuk page caching. WP Rocket Page Cache serve HTML dari disk via PHP, tetap lewat FPM. Nginx FastCGI Cache serve HTML langsung dari Nginx tanpa nyentuh PHP. Yang kedua jauh lebih cepat untuk TTFB.
Redis vs Memcached untuk Object Cache?
Redis. Alasannya: persistence opsional, data structure lebih kaya, dan plugin Till Krüss support-nya lebih lengkap. Memcached cuma key-value sederhana, di 2026 sudah jarang dipakai untuk WordPress.
OPcache JIT worth dinyalakan untuk WordPress?
Marginal. WordPress heavy I/O (DB, file, network), bukan CPU-bound. Improvement saya ukur sekitar 3-5 persen. Saya nyalakan karena jit_buffer_size=64M tidak rugi RAM, tapi jangan ekspektasi loncatan besar.
Berapa RAM minimum untuk 3-layer cache?
VPS 2 GB cukup untuk WordPress normal. Alokasi saya di VPS 4 GB: OPcache 128 MB, Redis maxmemory 256 MB (aktual 78 MB), Nginx fcgi_cache 100 MB keys_zone + 2 GB disk. Sisanya untuk PHP-FPM worker pool dan MariaDB innodb_buffer_pool.
Apakah Cloudflare APO menggantikan 3-layer cache ini?
Tidak sepenuhnya. APO cache HTML WordPress di edge Cloudflare. Tapi APO tidak menggantikan OPcache dan tidak menggantikan Object Cache saat APO MISS atau saat user login. Kombinasi terbaik: 3-layer di origin + APO di edge.
11. Penutup
Bottleneck WordPress di VPS yang spec-nya sudah lumayan (2 vCPU / 4 GB ke atas) jarang sekali di hardware. Hampir selalu di arsitektur cache yang salah, entah tidak ada, atau ada tapi double, atau setup-nya asal install plugin tanpa menyentuh Nginx sama sekali.
Setup di atas adalah yang saya pakai di production sendiri dan di setidaknya 14 site klien LarhTech. Hasilnya konsisten: TTFB di bawah 200 ms, PHP request rate turun 80–90%, dan MariaDB hampir nganggur sepanjang hari.
Kalau ingin dalami tiap layer lebih jauh:
- Tembus PageSpeed 100% Via Nginx FastCGI Cache
- Cara Saya Menginstall WordPress di Ubuntu
- Kunci Lulus Ujian PageSpeed Dengan Mengatur Browser Cache Expiry
- Mengatasi Error saat 502 Bad Gateway Saat Pindah Versi PHP
Pertanyaan, error spesifik, atau kasus aneh di setup Anda? Tinggalkan komentar di bawah, saya jawab.
Last Updated on Mei 23, 2026 by larhtechBro

")