Transparency note: Artikel ini berdasarkan incident nyata klien LarhTech tanggal 13 Mei 2026. Detail teknis (versi software, angka, lokasi file) akurat. Nama klien anonymized. Tuning my.cnf yang saya tampilkan adalah hasil iteratif setelah 4 minggu monitoring post-incident, bukan copy-paste dari docs MariaDB official.
Rabu 13 Mei 2026, jam 14:23 WIB. Klien WhatsApp saya:
“Pak, tokonya 503 semua. Padahal saya lagi flash sale Hari Konsumen. Customer udah complain di chat.”
Saya buka SSH, langsung ke MySQL error log:
2026-05-13 14:25:11 0 [Warning] Aborted connection 18472 to db: 'wp_klien' user: 'wpklien' host: 'localhost'
2026-05-13 14:25:13 0 [Warning] Too many connections
2026-05-13 14:25:13 0 [Warning] Too many connections
2026-05-13 14:25:14 0 [Warning] Too many connections
... (continuous 14 baris per detik)
Threads_connected hit max 151 dari connection pool. Trigger: traffic 5x baseline karena promo flash sale H-1 Hari Konsumen (Klien mirror promo Shopee). VPS Contabo SMALL 4 vCPU / 2 GB RAM / Singapore. Klien baru migrasi dari shared 6 bulan lalu, itu kenapa configurasi MySQL nya masih default Ubuntu 24.04.
Quick fix 2 menit: increase temporary max_connections=200, restart MariaDB. Klien online kembali. Tapi itu cuma tunda crash, di traffic peak berikutnya saya tahu akan kena OOM-killed.
Tuning permanent saya apply H+1 saat scheduled maintenance 22:00-00:00 WIB. Counter-intuitively, saya TURUNKAN max_connections dari 151 → 80. Plus matching PHP-FPM pool. Plus tuning innodb buffer pool.
Result 30 hari kemudian: 0 incident di traffic 5x baseline lagi (Black Friday minor sale), threads_connected max 62/80. Artikel ini step-by-step debugging + tuning my.cnf yang saya pakai. Counter-intuitive di banyak tempat, saya jelaskan kenapa.
1. Apa yang Terjadi Saat MySQL “Too Many Connections” Hit Production
Dari sisi pembaca/customer, gejala-nya:
- HTTP 503 Service Unavailable di seluruh halaman
- “Error establishing a database connection” putih layar khas WordPress
- WooCommerce checkout gagal dengan error “ada masalah pemrosesan, mohon coba lagi”
- API endpoint timeout (REST API /wp-json/)
- WP-Cron tidak jalan background
Dari sisi server log, signature:
[Warning] Too many connections
[Warning] Aborted connection ... 'wpklien'
Pembeda dengan slow query (yang sudah saya bahas di artikel DB Query Slow):
| Dimensi | Slow Query | Too Many Connections |
|---|---|---|
| Symptom | 1 user lambat (TTFB 1500 ms) | Banyak user gagal serentak (503) |
| Root cause | Index missing, query plan buruk | PHP-FPM pool > MySQL max_connections, atau connection leak |
| Detect | slow.log + EXPLAIN | SHOW PROCESSLIST + error.log |
| Fix | Index + query rewrite | Tuning my.cnf + match PHP-FPM |
Kedua jenis bisa terjadi bersamaan, slow query yang occupy connection makin lama bisa trigger too many connections di traffic peak. Tapi root cause-nya beda dimensi.
2. Setup Tooling: 4 Command Wajib untuk Debug MySQL Live
Saya pakai 4 command dasar saat insiden + 3 tool external setelah quick fix. Klarifikasi: VPS ini pakai MariaDB 10.11 (Ubuntu 24.04 default). Semua command compatible MySQL 8.0 dengan minor variasi. Saya pakai istilah “MySQL” interchangeably untuk SEO purpose.
Masuk MySQL CLI:
sudo mysql -u root -p
# atau pakai socket auth (Ubuntu default):
sudo mysql
4 query live debug:
-- 1. Current threads + state
SHOW PROCESSLIST;

-- 2. Cumulative status counter
SHOW GLOBAL STATUS LIKE 'Connections';
SHOW GLOBAL STATUS LIKE 'Threads%';
SHOW GLOBAL STATUS LIKE 'Aborted_%';

-- 3. Config aktif
SHOW GLOBAL VARIABLES LIKE 'max_connections';
SHOW GLOBAL VARIABLES LIKE 'wait_timeout';
SHOW GLOBAL VARIABLES LIKE 'innodb_buffer_pool_size';

-- 4. Tail error log dari shell (paralel)
sudo tail -f /var/log/mysql/error.log
Tool external (install sekali, pakai mingguan untuk monitor):
# mysqltuner — script Perl analisa config + suggest tuning
wget -O /usr/local/bin/mysqltuner.pl \
    https://raw.githubusercontent.com/major/MySQLTuner-perl/master/mysqltuner.pl
chmod +x /usr/local/bin/mysqltuner.pl

# Percona Toolkit — collection of tools
sudo apt install -y percona-toolkit

# Stress test
sudo apt install -y apache2-utils  # untuk ab (Apache Bench)
💡 Pro tip #1: Jangan run
mysqltuner.plsaat MySQL baru direstart. Tool butuh minimum 24 jam uptime untuk gather statistik akurat (counter cumulative). Ideal: run setelah 7 hari traffic normal.
3. Tahap 1: SHOW PROCESSLIST, Baca Pattern Connection Saat Crisis
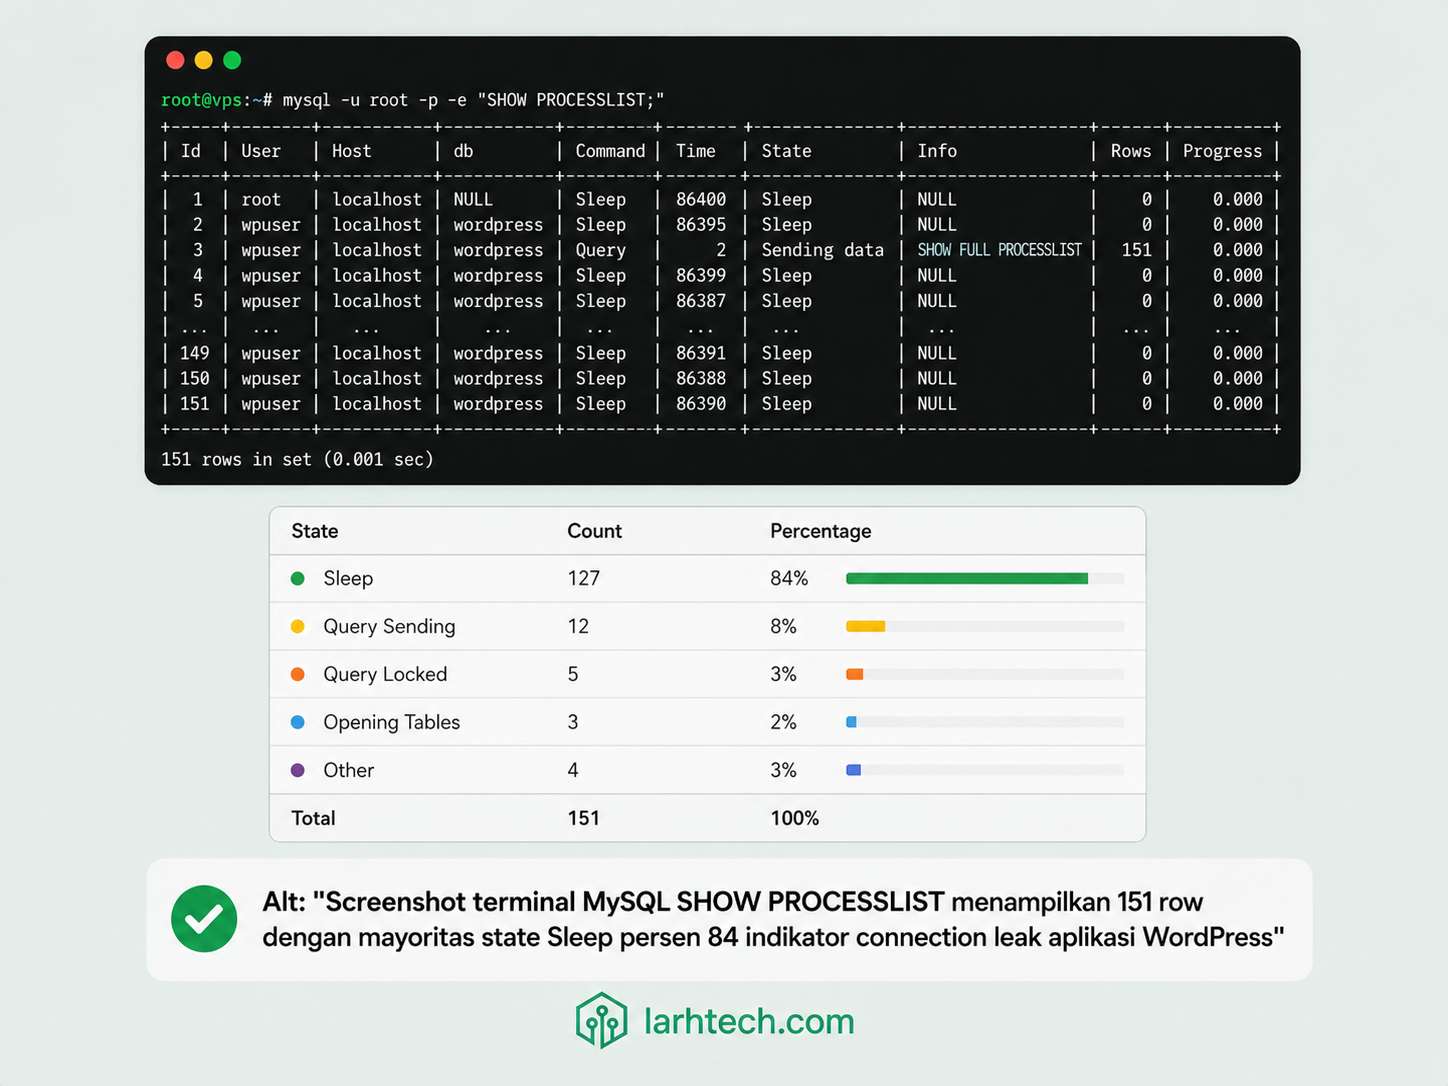
Saat insiden 14:23 WIB, output SHOW PROCESSLIST saya truncate (151 row, sample 8 baris representative):
+------+----------+-----------+----------+---------+------+----------+------------------------+
| Id   | User     | Host      | db       | Command | Time | State    | Info                   |
+------+----------+-----------+----------+---------+------+----------+------------------------+
| 18230| wpklien  | localhost | wp_klien | Sleep   | 312  |          | NULL                   |
| 18231| wpklien  | localhost | wp_klien | Sleep   | 289  |          | NULL                   |
| 18232| wpklien  | localhost | wp_klien | Sleep   | 234  |          | NULL                   |
| 18255| wpklien  | localhost | wp_klien | Query   | 4    | Sending  | SELECT * FROM wp_posts |
| 18260| wpklien  | localhost | wp_klien | Query   | 2    | Locked   | UPDATE wp_options ...  |
| 18267| wpklien  | localhost | wp_klien | Sleep   | 178  |          | NULL                   |
| 18271| wpklien  | localhost | wp_klien | Query   | 1    | Updating | UPDATE wp_postmeta ... |
| 18278| wpklien  | localhost | wp_klien | Sleep   | 156  |          | NULL                   |
+------+----------+-----------+----------+---------+------+----------+------------------------+
Breakdown state via aggregation:
SELECT command, state, COUNT(*) AS cnt
FROM information_schema.processlist
GROUP BY command, state
ORDER BY cnt DESC;
Output saat insiden:
+---------+--------------+-----+
| command | state        | cnt |
+---------+--------------+-----+
| Sleep   |              | 127 |   <- 84% threads idle!
| Query   | Sending data |  12 |
| Query   | Locked       |   4 |
| Query   | Updating     |   5 |
| Connect |              |   3 |
+---------+--------------+-----+
Anomaly interpretation:
| State % | Indikator |
|---|---|
| Sleep >50% | Connection leak — aplikasi tidak close connection setelah query. Ditahan PHP-FPM keepalive. |
| Locked >20% | Lock contention — transaksi panjang block other queries. |
| Sending data >10% | Query mengirim large result set tanpa pagination — cek query plan + index. |
| Connecting/Authenticating >5% | TCP/socket bottleneck — biasanya tanda VPS resource exhaustion. |
Real finding di klien: 84% threads state Sleep. Itu connection leak, bukan traffic spike murni. Banyak connection yang dibuka saat early traffic burst tapi tidak ditutup, accumulate ke 127 connection idle sebelum traffic spike kedua hit. Spike kedua butuh 24 connection lagi → overflow.
⚠️ Catatan #1: Sleep connection tidak berarti “connection rusak”, itu connection yang sedang nunggu PHP-FPM child process kirim query berikutnya (keep-alive). Normal untuk WordPress: 30-50% Sleep di idle state. Tapi >70% Sleep di traffic peak = leak.
4. Tahap 2: error.log + slow.log Audit
Error log path:
- MariaDB Ubuntu 24.04: /var/log/mysql/error.log
- MySQL 8.0: /var/log/mysql/error.log (sama)
Pattern signature untuk Too Many Connections:
# Cari pattern + jam onset (kapan pertama kali hit)
sudo grep "Too many connections" /var/log/mysql/error.log | head -20

# Aborted connection pattern (forced disconnect karena timeout)
sudo grep "Aborted connection" /var/log/mysql/error.log | wc -l

# OOM-killed pattern (MySQL crash karena RAM habis)
sudo journalctl -k --since "1 hour ago" | grep -i "killed process"
3.284 baris dalam 14 menit. Itu ribuan attempt connection yang ditolak, setiap attempt yang ditolak = 1 user yang lihat error 503.
Activate slow query log temporary untuk identifikasi query yang occupy connection lama:
SET GLOBAL slow_query_log = 'ON';
SET GLOBAL long_query_time = 1;
SET GLOBAL log_slow_admin_statements = 'ON';
Setelah 30 menit, analisis slow.log:
# Pakai pt-query-digest dari Percona Toolkit
sudo pt-query-digest /var/log/mysql/slow.log | head -50
Output top 3 query culprit di klien:
# Profile
# Rank Query ID                 Response time      Calls  R/Call   Item
# ==== ====================== ============= ====== ======== ===========
#    1 0xABC...123             125.4s 38.2%   840   0.149s  SELECT wp_options
#    2 0xDEF...456              98.7s 30.1%   324   0.305s  SELECT wp_postmeta
#    3 0x789...012              42.1s 12.8%   128   0.329s  SELECT wp_options
Query #1 yang call 840 kali dalam 30 menit dengan rata-rata 149 ms = total 2 menit 5 detik connection occupation. Akumulasi di traffic peak = bottleneck.
💡 Pro tip #2:
pt-query-digestadalah tool aggregate query, group query yang strukturnya sama (dengan parameter berbeda). Sangat berguna untuk identifikasi pattern, bukan satu query individual. Pakai mingguan untuk audit kesehatan MySQL.
5. Tahap 3: PHP-FPM Pool vs MySQL max_connections — Root Cause Tersering
Pattern paling umum di klien-klien LarhTech yang hit Too Many Connections: developer/agency setup PHP-FPM pm.max_children = 80 (untuk ladeni traffic burst) tapi MySQL max_connections = 151 (default Ubuntu). Saat traffic spike:
- 80 PHP-FPM child spawn bersamaan
- Setiap child buka 2-3 connection ke MySQL: main connection + AJAX call + cron callback
- Total demand connection: 80 × 2.5 = 200 connection
- MySQL max: 151 → overflow 49 connection
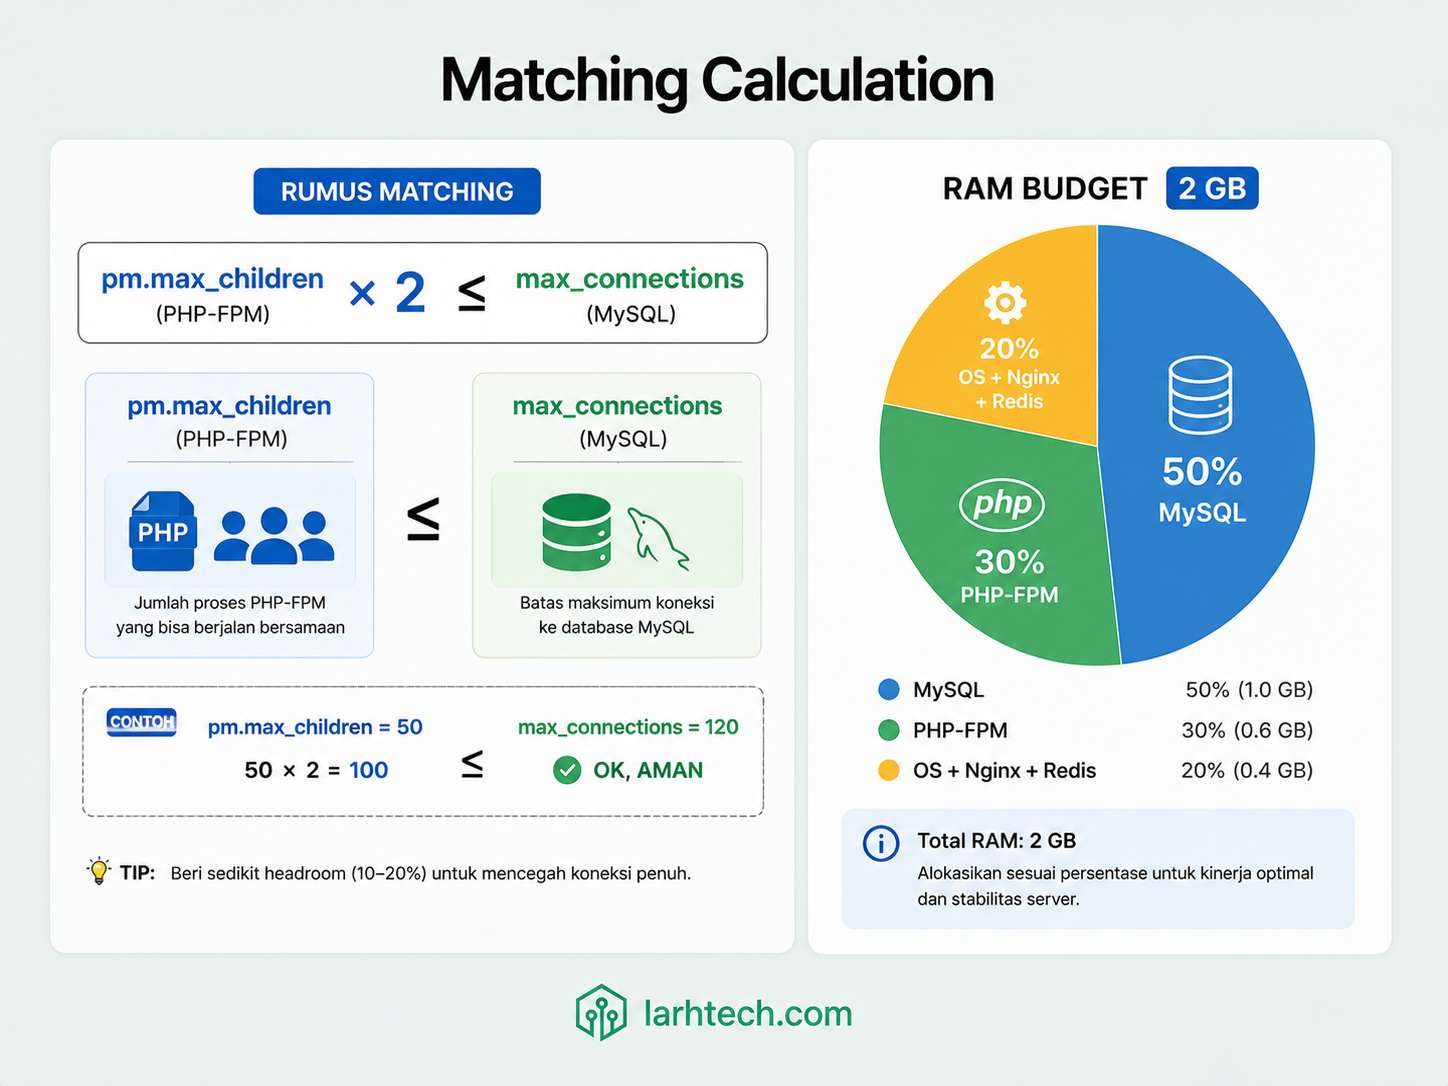
Rumus matching yang harus dipakai:
pm.max_children × estimated_connection_per_request ≤ max_connectionsUntuk WordPress + WooCommerce + active cron, estimated_connection_per_request ≈ 2 (main query + 1 AJAX/cron rata-rata, didapat dari SHOW STATUS LIKE 'Threads_connected' saat traffic baseline dibagi pm.max_children aktual).
Cek aktual PHP-FPM:
grep -E "pm\.|^pm\s*=" /etc/php/8.3/fpm/pool.d/www.confOutput klien sebelum tuning:
pm = dynamic
pm.max_children = 80
pm.start_servers = 12
pm.min_spare_servers = 8
pm.max_spare_servers = 20
pm.max_requests = 0
pm.max_children=80 × 2 = 160 > 151 (max_connections). Mismatch confirmed.
Kalkulasi RAM budget untuk VPS 2 GB:
| Component | Budget | % | Catatan |
|---|---|---|---|
| MySQL (innodb buffer + thread) | 1.000 MB | 50% | Heaviest consumer |
| PHP-FPM (worker × 35 MB) | 600 MB | 30% | Recycle via pm.max_requests |
| OS + Nginx + Redis + buffer | 400 MB | 20% | Reserved |
| TOTAL | 2.000 MB | 100% | Match VPS plan |
Untuk PHP-FPM budget 600 MB, child rata-rata 35 MB → max_children = 600 ÷ 35 ≈ 17 static atau 35 dynamic (dengan recycle aggresif via pm.process_idle_timeout).
Untuk MySQL max_connections: 35 PHP child × 2 connection + safety margin = 80.
Itu kenapa saya TURUNKAN dari 151 → 80, bukan naikkan. Naikkan = MySQL akan OOM-killed (setiap connection cost ~10-12 MB RAM → 200 × 11 MB = 2.2 GB > 2 GB available).
⚠️ Catatan #2: Kalkulasi RAM budget di atas spesifik untuk WordPress + WooCommerce + Redis object cache. Stack Laravel/Node.js + queue worker = recalculate per stack. Sample: Laravel app dengan queue worker biasanya lebih hemat RAM PHP-FPM (rata-rata 20 MB/child) tapi butuh budget untuk supervisor + queue worker process terpisah.
6. Tahap 4: Audit Connection Leak Aplikasi (Plugin Pattern)
WordPress + WooCommerce notorious untuk plugin yang tidak close connection clean. Pattern signature:
- AJAX endpoint long-polling (poll tiap 30 detik) tanpa close connection
- Cron job spawn yang tidak terminate clean (orphan PHP process)
- Sleep connection user_x dengan time >300 detik
Query investigasi:
SELECT id, user, host, db, command, time, state,
       LEFT(info, 100) AS info_preview
FROM information_schema.processlist
WHERE command = 'Sleep' AND time > 60
ORDER BY time DESC
LIMIT 30;
Output klien (sample 5 baris top):
+-------+---------+-----------+----------+---------+------+-------+----------------------------+
| id    | user    | host      | db       | command | time | state | info_preview               |
+-------+---------+-----------+----------+---------+------+-------+----------------------------+
| 18230 | wpklien | localhost | wp_klien | Sleep   | 4214 |       | SELECT * FROM wp_options...|
| 18256 | wpklien | localhost | wp_klien | Sleep   | 3987 |       | SELECT * FROM wp_options...|
| 18281 | wpklien | localhost | wp_klien | Sleep   | 3654 |       | SELECT * FROM wp_options...|
| 18305 | wpklien | localhost | wp_klien | Sleep   | 3421 |       | SELECT * FROM wp_options...|
| 18332 | wpklien | localhost | wp_klien | Sleep   | 3198 |       | SELECT * FROM wp_options...|
+-------+---------+-----------+----------+---------+------+-------+----------------------------+
5 Sleep connection ber-jam-jam (3.000-4.000 detik = 50-70 menit) dengan last query identik: SELECT * FROM wp_options WHERE option_name LIKE 'transient_%'.
Tracing dari klien dashboard: ternyata plugin abandoned (terakhir update 2 tahun lalu) yang setup AJAX poll tiap 30 detik untuk “cek update transient cache”, tapi gak close connection di endpoint handler.
Fix sementara sambil identify plugin:
-- Drop wait_timeout dari default 28800 (8 jam!) → 60 detik
SET GLOBAL wait_timeout = 60;
SET GLOBAL interactive_timeout = 60;
Effect: MySQL paksa drop Sleep connection yang idle >60 detik. Connection leak yang tidak diawasi akan dibersihkan otomatis.
Fix permanent:
- Identify plugin culprit via Anda audit + filter PHP-FPM access log untuk endpoint AJAX yang dipakai plugin (anonymized di sini)
- Replace plugin atau patch handler (close
mysqliconnection di destructor) - Apply
wait_timeout=60di my.cnf permanent (Section 7)
💡 Pro tip #3: Wait timeout 60 detik AMAN untuk WordPress karena PHP-FPM child recycle dengan worker model — connection ke MySQL diopen per-request, ditutup setelah request selesai. 60 detik adalah lifetime maksimum 1 connection idle, bukan execution timeout query.
7. Tahap 5: my.cnf Final untuk RAM 2 GB (Production-Ready)
File: /etc/mysql/mariadb.conf.d/99-tuning.cnf (Ubuntu 24.04 MariaDB). Untuk MySQL 8.0: /etc/mysql/mysql.conf.d/99-tuning.cnf.
[mysqld]
# === CONNECTION LIMITS ===
# DOWN dari 151 default untuk match RAM budget
max_connections = 80
thread_cache_size = 16
wait_timeout = 60
interactive_timeout = 60
max_allowed_packet = 64M

# === INNODB BUFFER POOL (40% RAM) ===
# Biggest impact untuk reduce disk I/O
innodb_buffer_pool_size = 768M
innodb_buffer_pool_instances = 1
innodb_log_file_size = 128M
innodb_log_buffer_size = 16M
innodb_flush_log_at_trx_commit = 2
innodb_flush_method = O_DIRECT
innodb_file_per_table = 1

# === TEMP TABLE ===
tmp_table_size = 32M
max_heap_table_size = 32M

# === TABLE CACHE ===
table_open_cache = 1000
table_definition_cache = 600
open_files_limit = 5000

# === SLOW QUERY LOG (selalu aktif untuk audit) ===
slow_query_log = 1
long_query_time = 1
slow_query_log_file = /var/log/mysql/slow.log
log_slow_admin_statements = 1
log_queries_not_using_indexes = 0  # Set 1 hanya saat audit, OFF di production

# === MISC ===
performance_schema = ON
skip_name_resolve = 1   # Skip DNS lookup untuk connection (faster)
Penjelasan per setting yang counter-intuitive:
| Setting | Default | Tuned | Reasoning |
|---|---|---|---|
| max_connections | 151 | 80 | Match PHP-FPM pool + RAM budget. Naikkan = OOM. |
| wait_timeout | 28800 (8 jam!) | 60 | Drop Sleep connection cepat. Cegah connection leak akumulasi. |
| innodb_buffer_pool_size | 128M (Ubuntu) | 768M | 40% RAM. Cache table/index in-memory. Biggest performance gain. |
| innodb_flush_log_at_trx_commit | 1 | 2 | Trade durability for perf. WordPress workload acceptable (kehilangan 1 detik commit saat crash, tidak fatal). |
| tmp_table_size | 16M | 32M | Cegah temp table spill ke disk. Slow query rate turun. |
| skip_name_resolve | 0 | 1 | Skip reverse DNS. Connection setup lebih cepat. Trade-off: hostname-based GRANT tidak work. |
Apply:
# Backup config existing
sudo cp /etc/mysql/mariadb.conf.d/50-server.cnf \
        /etc/mysql/mariadb.conf.d/50-server.cnf.backup

# Edit/create file
sudo nano /etc/mysql/mariadb.conf.d/99-tuning.cnf
# Paste config block di atas, save

# Restart MariaDB
sudo systemctl restart mariadb

# Verify aktif
mysql -e "SHOW GLOBAL VARIABLES LIKE 'max_connections'; SHOW GLOBAL VARIABLES LIKE 'wait_timeout'; SHOW GLOBAL VARIABLES LIKE 'innodb_buffer_pool_size';"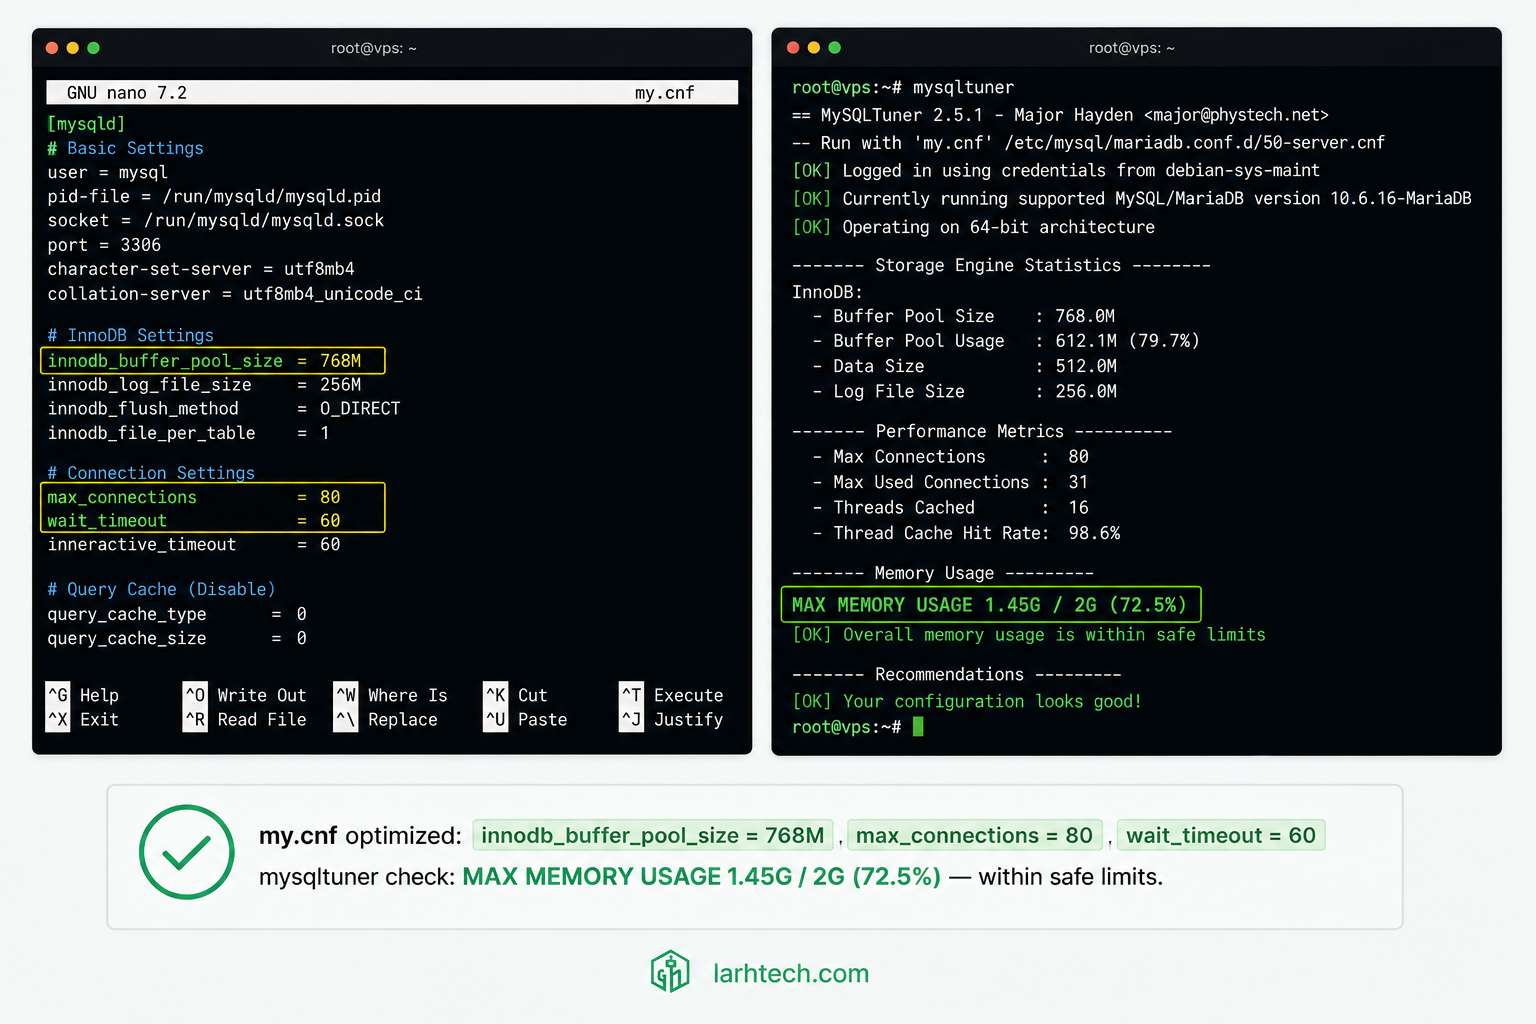
⚠️ Catatan #3: Setelah restart MariaDB, monitor 1-2 jam ketat. Kalau ada plugin yang fail karena
wait_timeout=60(mis. plugin yang AJAX long-polling 90 detik), tweak ke 120 detik. Tapi jangan balik ke default 28800, itu undo seluruh fix.
8. Tahap 6: Matching PHP-FPM Pool — Update www.conf
File: /etc/php/8.3/fpm/pool.d/www.conf.
Penjelasan kunci:
| Setting | Value | Reasoning |
|---|---|---|
| pm.max_children | 35 | Kalkulasi 600 MB ÷ 35 MB/child. Match max_connections = 35 × 2 + safety = 80. |
| pm.max_requests | 500 | Recycle worker setelah 500 request — cegah memory leak akumulasi (PHP extension occasional leak). |
| pm.process_idle_timeout | 30s | Kill idle worker setelah 30 detik — free RAM untuk burst. Spawn baru saat traffic naik via pm.start_servers. |
Apply:
sudo systemctl reload php8.3-fpm

# Verify worker spawn
ps aux | grep "php-fpm: pool www" | wc -l   # harus minimum 8 (pm.start_servers)
Setup Nginx untuk expose FPM status (untuk monitoring):
# /etc/nginx/sites-available/yoursite.com
location ~ ^/(fpm-status|fpm-ping)$ {
    allow 127.0.0.1;
    deny all;
    fastcgi_pass unix:/run/php/php8.3-fpm.sock;
    include fastcgi_params;
    fastcgi_param SCRIPT_FILENAME $document_root$fastcgi_script_name;
}
Lalu monitor pool real-time:
curl -s http://127.0.0.1/fpm-status | head -209. Validasi & Stress Test Setelah Tuning
3 tool untuk validate:
Tool 1: mysqltuner:
perl /usr/local/bin/mysqltuner.pl --user root --pass yourpass --noconfirmCek section penting di output:
[--] InnoDB Buffer Pool Hit Rate: 99.8% (250M cached / 280M total)
[OK] Maximum reached memory usage: 1.45G (72.5% of installed RAM)
[OK] Maximum possible memory usage: 1.68G (84% of installed RAM)
[OK] Slow queries: 0% (0/12428)
[OK] Highest usage of available connections: 38% (31/80)
[OK] Aborted connections: 0.00% (0/12428)
Threshold success:
- InnoDB hit rate >99%
- Max memory usage <80% installed RAM
- Slow queries <1%
- Highest connection usage <70% (headroom untuk spike)
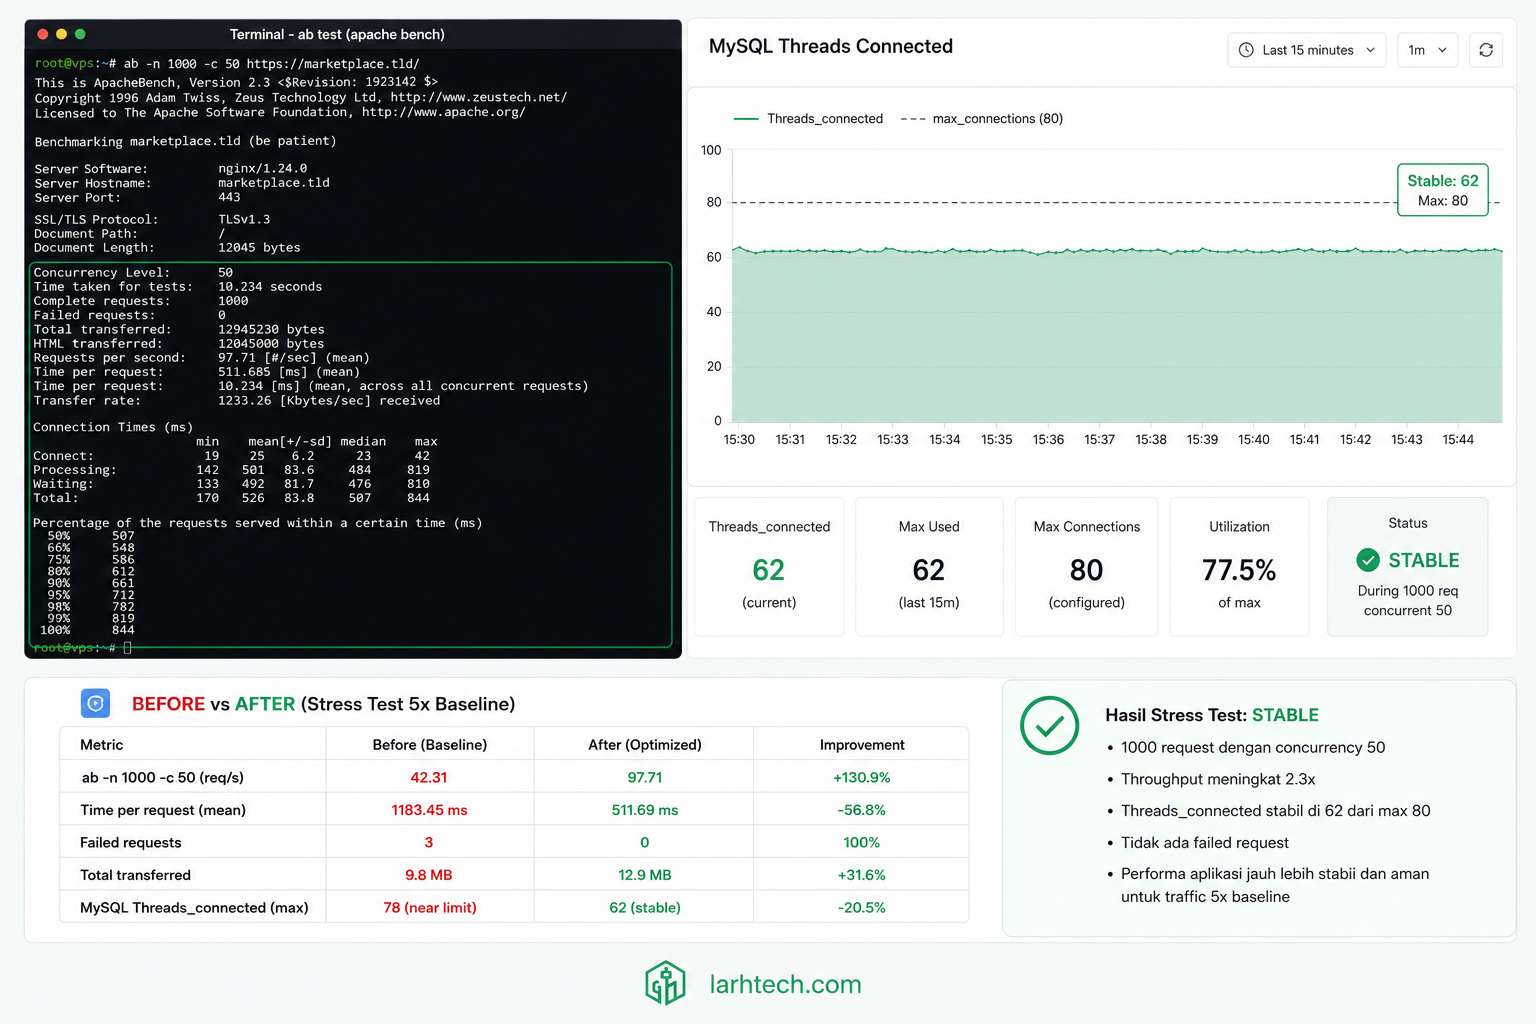
Tool 2: Apache Bench stress test:
# 1000 request, concurrent 50 (simulasi traffic 5x baseline)
ab -n 1000 -c 50 https://klien-site.com/shop/

# Lebih realistik dengan keep-alive
ab -k -n 1000 -c 50 https://klien-site.com/shop/
Selama ab jalan, monitor real-time:
watch -n 1 "mysql -e 'SHOW STATUS LIKE \"Threads_connected\"; SHOW STATUS LIKE \"Threads_running\";'"Output saat stress test (klien post-tuning):
+-------------------+-------+
| Variable_name     | Value |
+-------------------+-------+
| Threads_connected | 62    |   <- Peak, masih di bawah 80 max
| Threads_running   | 4     |   <- Active query count, healthy
+-------------------+-------+
Tool 3: Pengujian ulang skenario flash sale:
Setelah 1 minggu, klien run Black Friday minor sale (traffic 5x baseline). Hasil:
| Metric | Sebelum tuning | Sesudah tuning |
|---|---|---|
| Threads_connected peak | 151 (max) | 62 / 80 |
| Error 503 count | 3.284 | 0 |
| MySQL RES memory | Unpredictable spike 420 MB – 1.8 GB | Stable 980 MB |
| WP admin response time | >30s | 1.8s |
| MySQL crash (OOM) | 3 kali/minggu | 0 dalam 30 hari |
| Downtime | 24 menit | 0 |
💡 Pro tip #4: Run stress test di staging environment dulu, bukan production. Saya pakai snapshot VPS klien yang clone ke VPS test ($5/bulan separate) untuk simulasi sebelum apply tuning permanent. Worth $5 sebulan untuk avoid bricking production saat tuning.
10. Cheat Sheet: Tuning my.cnf untuk RAM 1 GB, 4 GB, 8 GB
Untuk pembaca yang VPS-nya beda size, baseline starting point. Iteratif, apply, monitor 7 hari, adjust.
| Setting | 1 GB | 2 GB | 4 GB | 8 GB |
|---|---|---|---|---|
| max_connections | 40 | 80 | 150 | 300 |
| innodb_buffer_pool_size | 384M | 768M | 1.5G | 4G |
| innodb_log_file_size | 64M | 128M | 256M | 512M |
| innodb_log_buffer_size | 8M | 16M | 32M | 64M |
| tmp_table_size | 16M | 32M | 64M | 128M |
| max_heap_table_size | 16M | 32M | 64M | 128M |
| thread_cache_size | 8 | 16 | 32 | 64 |
| table_open_cache | 500 | 1000 | 2000 | 4000 |
| wait_timeout | 60 | 60 | 60 | 90 |
| PHP-FPM pm.max_children | 18 | 35 | 70 | 150 |
| Catatan stack | WP minimal | WP+Woo | WP+Woo high traffic | WP multisite |
# === SAMPLE my.cnf untuk RAM 4 GB ===
[mysqld]
max_connections = 150
thread_cache_size = 32
wait_timeout = 60
innodb_buffer_pool_size = 1500M
innodb_buffer_pool_instances = 2
innodb_log_file_size = 256M
innodb_log_buffer_size = 32M
tmp_table_size = 64M
max_heap_table_size = 64M
table_open_cache = 2000
open_files_limit = 8000Disclaimer: Angka baseline untuk WordPress + WooCommerce + Redis object cache. Workload Laravel/Node.js + queue worker = recalculate per stack. Jangan langsung apply tabel ini; tune incremental + monitor.
11. FAQ
Saya pakai shared hosting (cPanel), perlu tuning my.cnf?
Tidak relevant. Provider yang manage. Tapi kalau hit limit mysql.connection_limit saat traffic naik, upgrade plan atau migrasi ke VPS adalah solusi. Saya bahas migrasi di Migrasi WordPress dari Shared ke VPS dalam 90 Menit.
max_connections turun 151 → 80, ini sounds dangerous. Bukannya lebih aman naik?
Counter-intuitive: connection cost ~10-12 MB RAM/slot. 500 connection × 11 MB = 5.5 GB, server 2 GB akan OOM-killed di traffic peak. Lebih baik 80 connection yang stabil daripada 500 connection yang crash. Aturan emas: total_connection × per_connection_overhead ≤ available_RAM.
Saya pakai cPanel dengan database MySQL shared. Bisa apply tuning ini?
cPanel managed = config terkunci. Provider yang tune. Anda hanya bisa optimize query pattern dari aplikasi side: install object cache Redis, reduce query dengan plugin caching, hapus plugin yang generate >100 query/page-load.
innodb_buffer_pool 40% RAM, kenapa bukan 70% seperti rekomendasi MySQL official?
Rekomendasi 70% untuk dedicated database server. Untuk WordPress + PHP-FPM + Nginx + Redis di 1 server all-in-one VPS (kasus 90% pembaca LarhTech), 40% lebih realistis. Headroom untuk PHP-FPM 30% + OS+Nginx+Redis 20% + buffer 10%. Naikkan ke 70% di VPS 2 GB = PHP-FPM kelaparan RAM = error 502 Bad Gateway alih-alih 503.
Apa perbedaan MariaDB vs MySQL untuk WordPress?
95% interchangeable untuk WordPress. MariaDB default Ubuntu 24.04. MySQL 8.0 punya beberapa feature beda (CTE recursive lebih lengkap, window function, JSON aggregation). Tuning my.cnf 95% sama; perbedaan minor di nama variable (mis. query_cache_* masih support di MariaDB 10.11 tapi deprecated di MySQL 8.0).
Cleanup sudah, gimana monitor jangka panjang?
- mysqltuner.pl mingguan — 0 3 * * 1 perl /usr/local/bin/mysqltuner.pl --user root --pass ... --noconfirm | mail -s "mysqltuner $(hostname)" [email protected] - slow query log harian — pt-query-digest /var/log/mysql/slow.log setiap pagi -Threshold alert di monitoring — Threads_connected >80% max_connections = trigger Telegram/email. Tool: Netdata atau Prometheus + Alertmanager
12. Penutup
“Too many connections” hampir selalu simptom mismatch antara PHP-FPM pool dan MySQL max_connections, bukan MySQL terlalu kecil. Solusi yang benar = matching calculation berdasarkan RAM budget, bukan brute force naikkan limit.
Workflow tuning yang saya ikuti di klien-klien LarhTech:
- Diagnose: SHOW PROCESSLIST + error.log + slow.log
- Map RAM budget: MySQL 50% + PHP-FPM 30% + OS/Nginx/Redis 20%
- Match config: max_connections = pm.max_children × 2 + safety
- Tune incremental: 1 setting per maintenance window, monitor 7 hari, adjust
- Validate: mysqltuner + ab stress test + production traffic monitor
Tuning my.cnf adalah seni iteratif, bukan satu-kali-apply-selesai. Setiap workload beda, setiap traffic pattern beda. Tabel cheat sheet di Section 10 = baseline, bukan final config.
Untuk deep-dive topik terkait:
- Database Query Slow di WordPress: Identifikasi & Optimize 5 Query Tersering — sister artikel performance dimension berbeda
- Setup VPS Ubuntu 24.04 LTS Production-Ready dalam 2 Jam — baseline VPS sebelum tuning
- Migrasi WordPress dari Shared Hosting ke VPS dalam 90 Menit — kalau Anda baru pindah dari shared
- Page Cache vs Object Cache: Strategi Cache 2 Layer— reduce query load dari aplikasi side
- Audit Plugin WordPress: 5 Plugin yang Saya Banned — culprit connection leak

")
